Mn dopant on the surface of GaAs
Figure 1
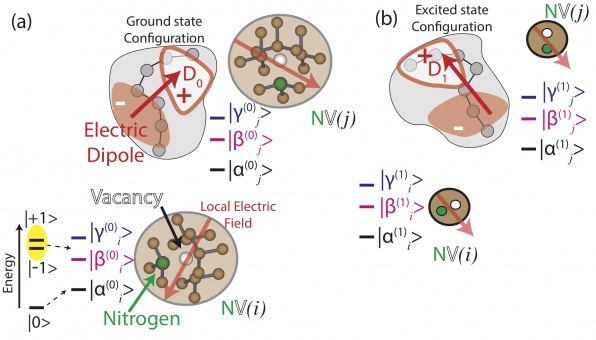
Toy model of single photon detection using a photoreceptor and a nitrogen vacancy (NV−) center in diamond. Also shown are the ground state (triplet) energy levels for the NV spin with a magnetic field in the axial direction (zˆ, pointing from N to V) and including zero-field splitting. The separations of energy levels are not drawn to scale. (a) No photon is absorbed so the spin evolves according to the photoreceptor’s electric dipole field in the photoreceptor’s ground state. (b) Photon is absorbed which induces an altered electric dipole field (in magnitude and direction) and modifies the coherent preces- sion of the NV− spin within the three ground-state sublevels. The two configurations are, in general, non-orthogonal, suggesting that POVM’s provide the optimal framework for measurement.
Figure 3
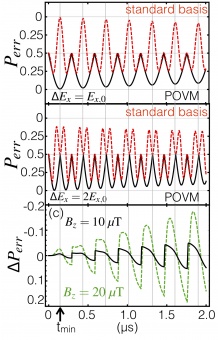
(a, b) Error probability calculated using POVMs (black solid line using Eq. 25) and the standard measurement basis (blue dashed line using Eq. 28) for electric fields Ex,0 = 107 V/m and Ex,1 = Ex,0 + ∆Ex. (a) ∆Ex is odd multiple of Ex,0: for certain times, the minimum Perr in the standard basis is equivalent to the minimum Perr in the POVM calculation. Vertical gray lines denote local minima in the error probability. (b) ∆Ex is even multiple of Ex,0: the minimum Perr in the standard basis is significantly worse than the minimum Perr in the POVM calculation. (c) Difference in Perr when an axial magnetic field is applied: ∆Pe = Perr(Bz)−Perr(0) using the POVM calculation and the same electric fields as in (a). The arrow on the bottom left of (c) points to tmin corresponding to (a) — the time at which the minimum error probability exists so the optimal time for a measurement to take place.
Figure 2
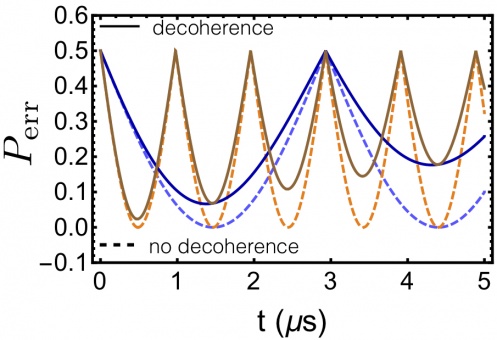
Minimum error probability, P , with (T = 10 μs) and err 2
without decoherence for two electric fields. Light/dark blue curves: ∆Ex = 106 V/m. Orange/brown curves: ∆Ex = 3 × 10⁶ V/m. Ey,0 = 0=∆Ey,Bz =0forallcurves.
Figure 4
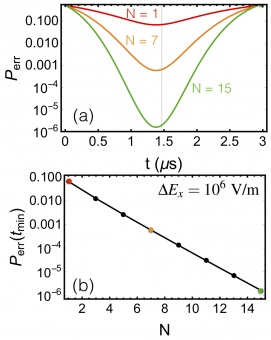
Error probability, Perr, at the best time for N=1,7,15 (red, orange, black) number of independent NV spin sensors. Vertical gray line denotes the best time for the measurement. (b) Error probability, Perr, evaluated at tmin for increasing number of independent NV spin sensors. Symbols are result of calculations; line is guide to eye.